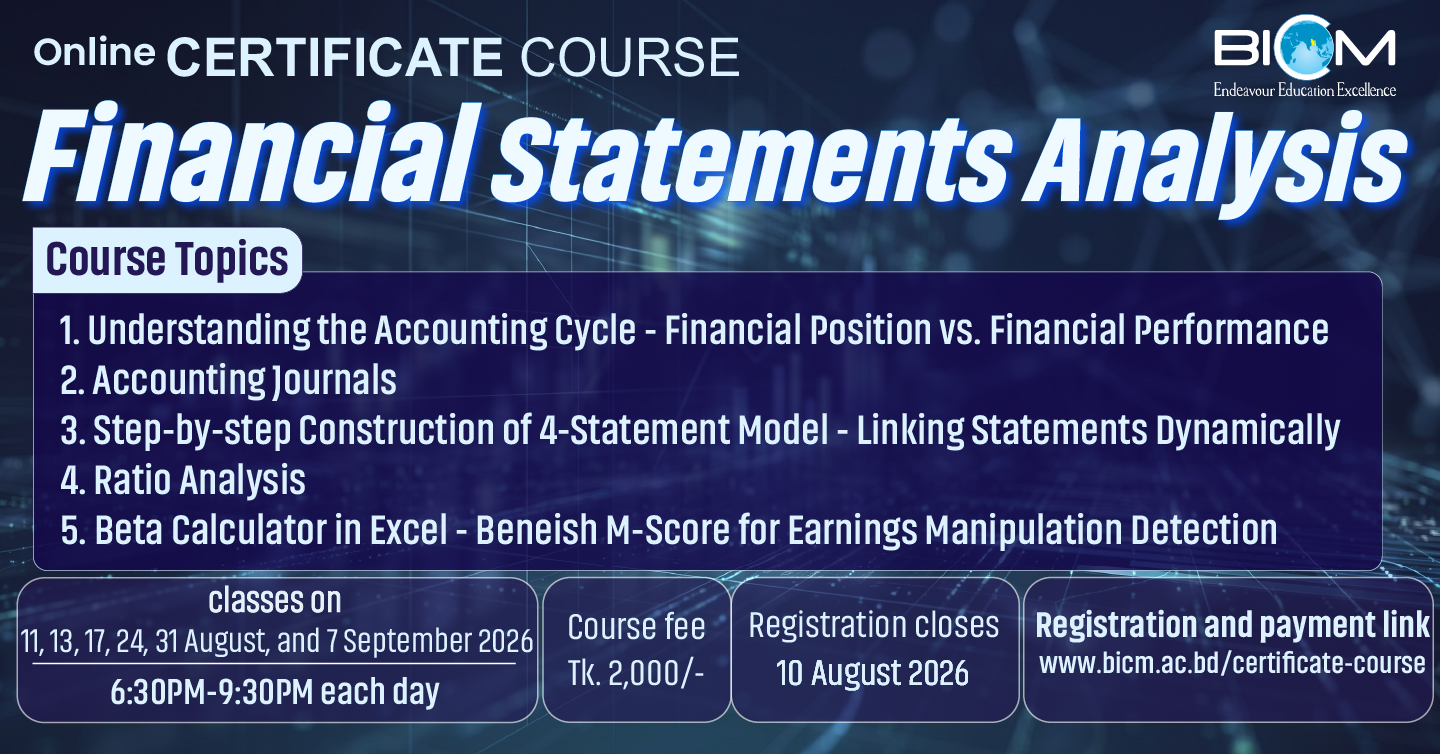
Course Objective:
The objective of this course is to equip participants with the technical and analytical skills required to understand and build dynamic 4-statement financial models. Participants will develop a clear understanding of how financial statements are interrelated, how business events are recorded through the accounting cycle, and how those transactions ultimately impact financial performance and position. Through a hands-on, Excel-based approach, learners will gain the ability to translate accounting data into structured financial models that reflect real-world scenarios. The course also emphasizes the integration of IFRS reporting standards, the treatment of off-balance sheet items, and the incorporation of adjusting and consolidation entries. By the end of the course, participants will be able to construct interactive and sensitive financial models, perform detailed financial analysis, and test various business assumptions through scenario and sensitivity tools.
This course is designed to provide participants with the applied financial modeling skills required to interpret, construct, and analyze various financial metrics and diagnostic tools using Excel. Emphasis is placed on building Excel-based models that capture key analytical techniques such as break-even and cost-volume-profit (CVP) analysis, financial ratio models, trend and common-size analysis, and statistical risk metrics like beta and Altman’s Z-score. The course will also introduce forensic tools like the Beneish M-Score and decomposition techniques such as DuPont analysis. Through structured exercises and templates, participants will enhance their ability to assess financial health, detect warning signals, and draw insights for decision-making using interactive and scenario-driven models.
Key Takeaways:
Upon successful completion, participants will be able to:
- Navigate the accounting cycle and journal-entry structure behind financial reporting.
- Link income statement results to the balance sheet and cash flows in Excel.
- Integrate IFRS principles, adjustments, and advanced journal treatments into financial models.
- Build line-by-line 4-statement models (Income Statement, Balance Sheet, Cash Flow Statement, and Statement of Changes in Equity) from raw data.
- Perform robust scenario-based analysis for banks and financial institutions.
- Analyze financial statement sensitivity to business and accounting changes.
- Build and interpret financial ratio, trend, and common-size analysis models in Excel.
- Create dynamic break-even and CVP analysis templates for decision support.
- Calculate beta and assess risk using historical return data.
- Apply DuPont and Beneish M-Score models to evaluate performance and detect manipulation.
- Use Altman Z-Score to identify financial distress early.
- Develop interactive dashboards to summarize key financial insights.
- Strengthen model auditing and scenario analysis skills for practical finance applications.
Topic 1: Understanding the Accounting Cycle - Financial Position vs. Financial Performance - P/L Account and its Impact on Balance Sheet - Bank/FI-specific Financial Features - Excel-Based Financial Analysis
Understand the cycle from transactions to final statements, distinguish how income and equity evolve through operation, explore financial statement structures for banks/FIs, learn vertical (common-size) and horizontal analysis, Apply Excel formulas for growth metrics, cash flow ratios, and consistency checks
Topic 2: Accounting Journals (Basic to Advanced) - Business Event Impacts - GL to Final Statements Process - IFRS-1 and IAS-1 Applications - Off-Balance Sheet and Adjusting Entries - M&A Related Adjustments
Journalizing real-life business transactions, Tracing entries from general ledger to financial statements, Applying international accounting standards (IFRS-1 and IAS-1), Identifying hidden liabilities and off-sheet risks, Handling fair value adjustments, goodwill, and consolidation entries
Topic 3: Ratio Analysis Templates - Common-Sizing & Trend Analysis in Excel - Break-even & CVP Analysis
Develop Excel models for liquidity, solvency, profitability, and efficiency ratios, Apply vertical (common-size) and horizontal (trend) analysis across time periods, Construct break-even and cost-volume-profit analysis templates with dynamic inputs, Scenario testing (e.g., margin, sales volume, fixed cost) for break-even models
Topic 4: Beta Calculator in Excel - Beneish M-Score for Earnings Manipulation Detection - DuPont Decomposition Analysis
Use historical return data to compute beta using regression in Excel, Build Beneish M-Score model to detect potential earnings manipulation using 8 key ratios, Develop DuPont analysis model to dissect ROE into operational, efficiency, and leverage components
Topic 5: Altman Z-Score Model in Excel - Dashboarding and Summary Metrics - Model Audit & Scenario Simulation
Create dynamic Altman Z-score model with conditional formatting and traffic-light indicators, Consolidate outputs into interactive dashboards, Integrate scenario testing and assumption toggles across models, Final model presentation and audit checklist